Heating System Visualization
Monitoring dashboard2024
preview
What it is
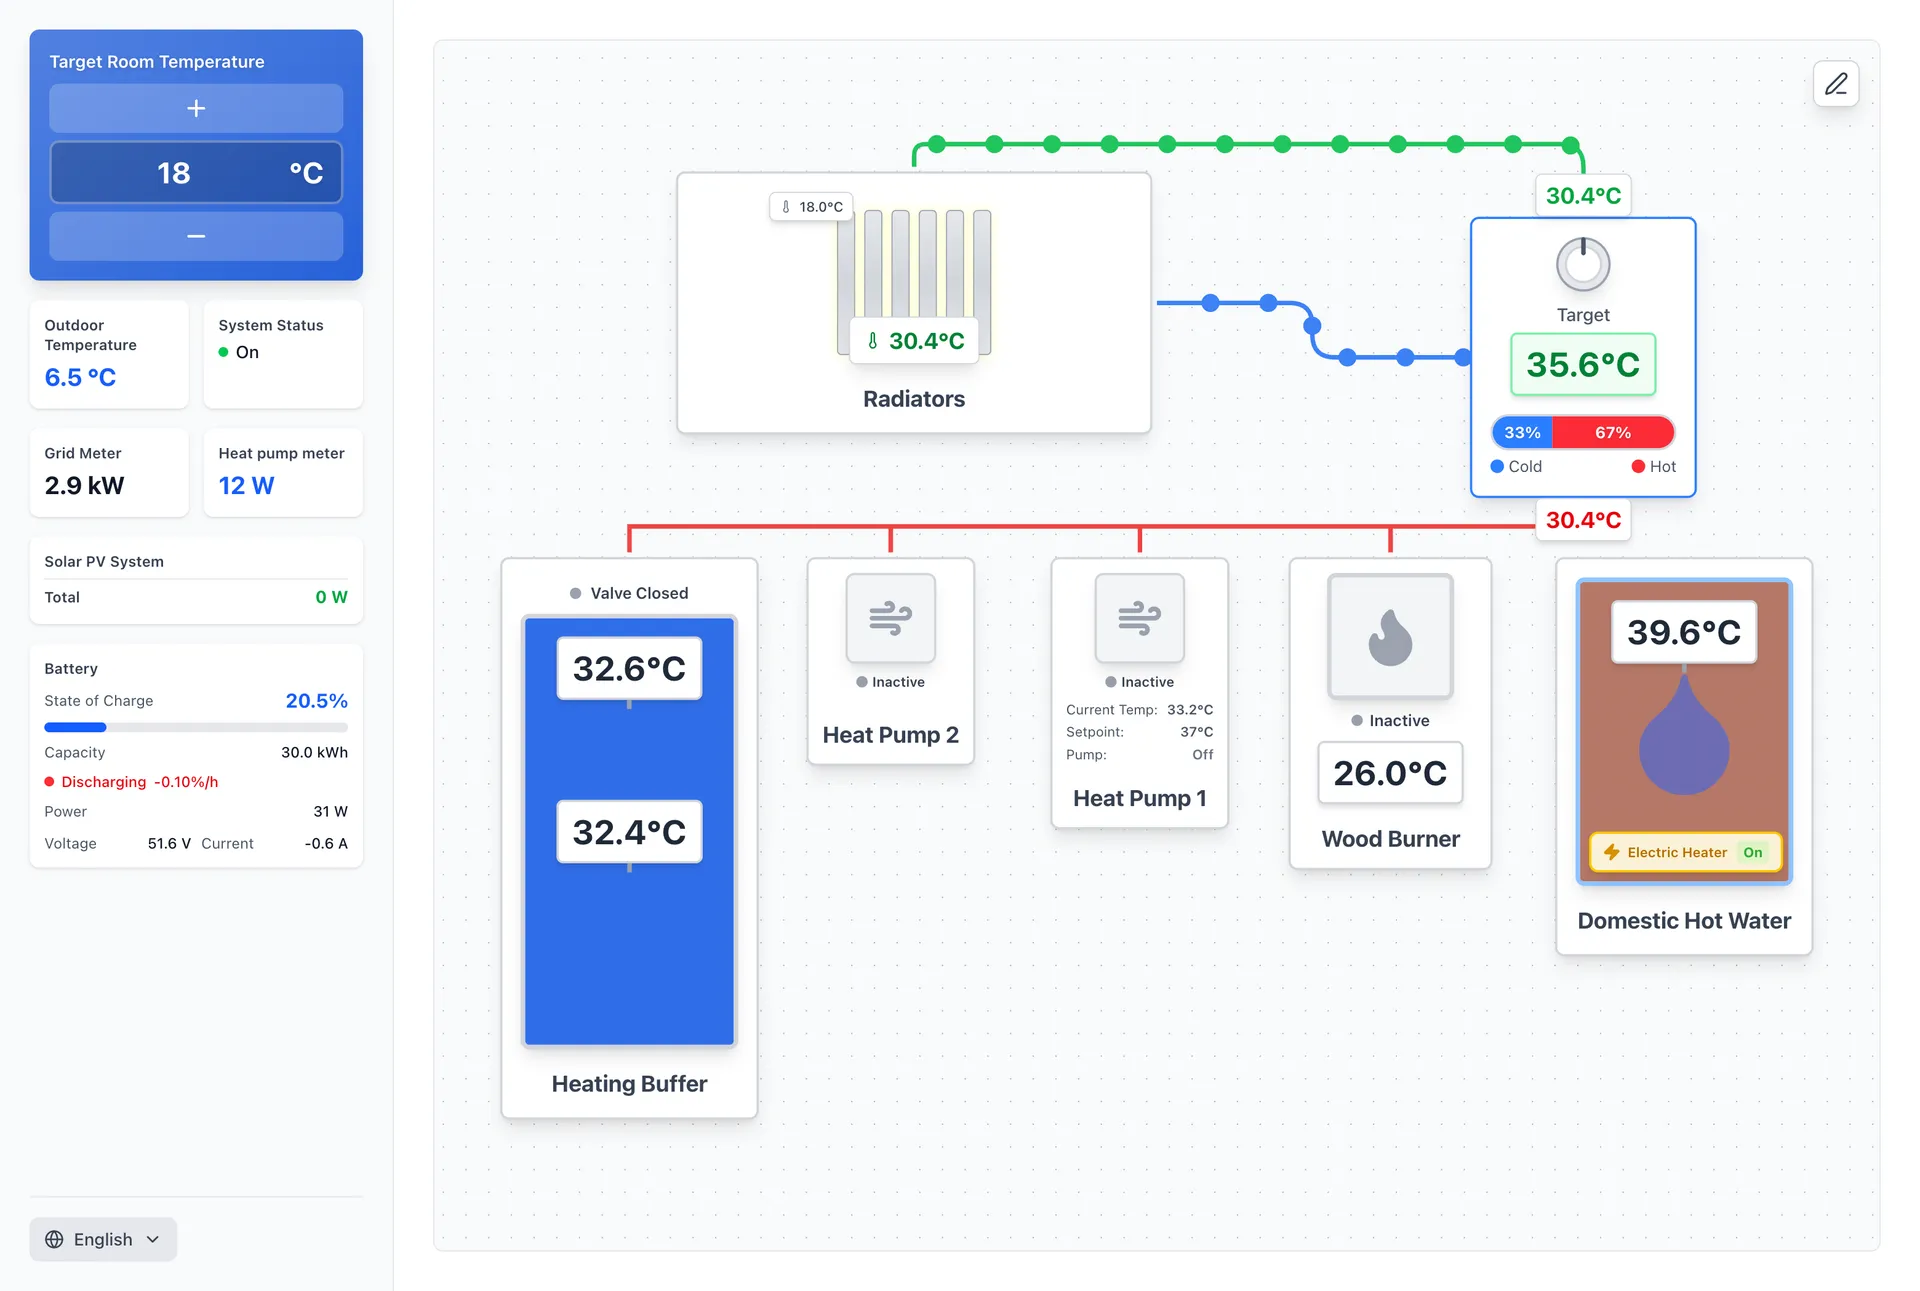
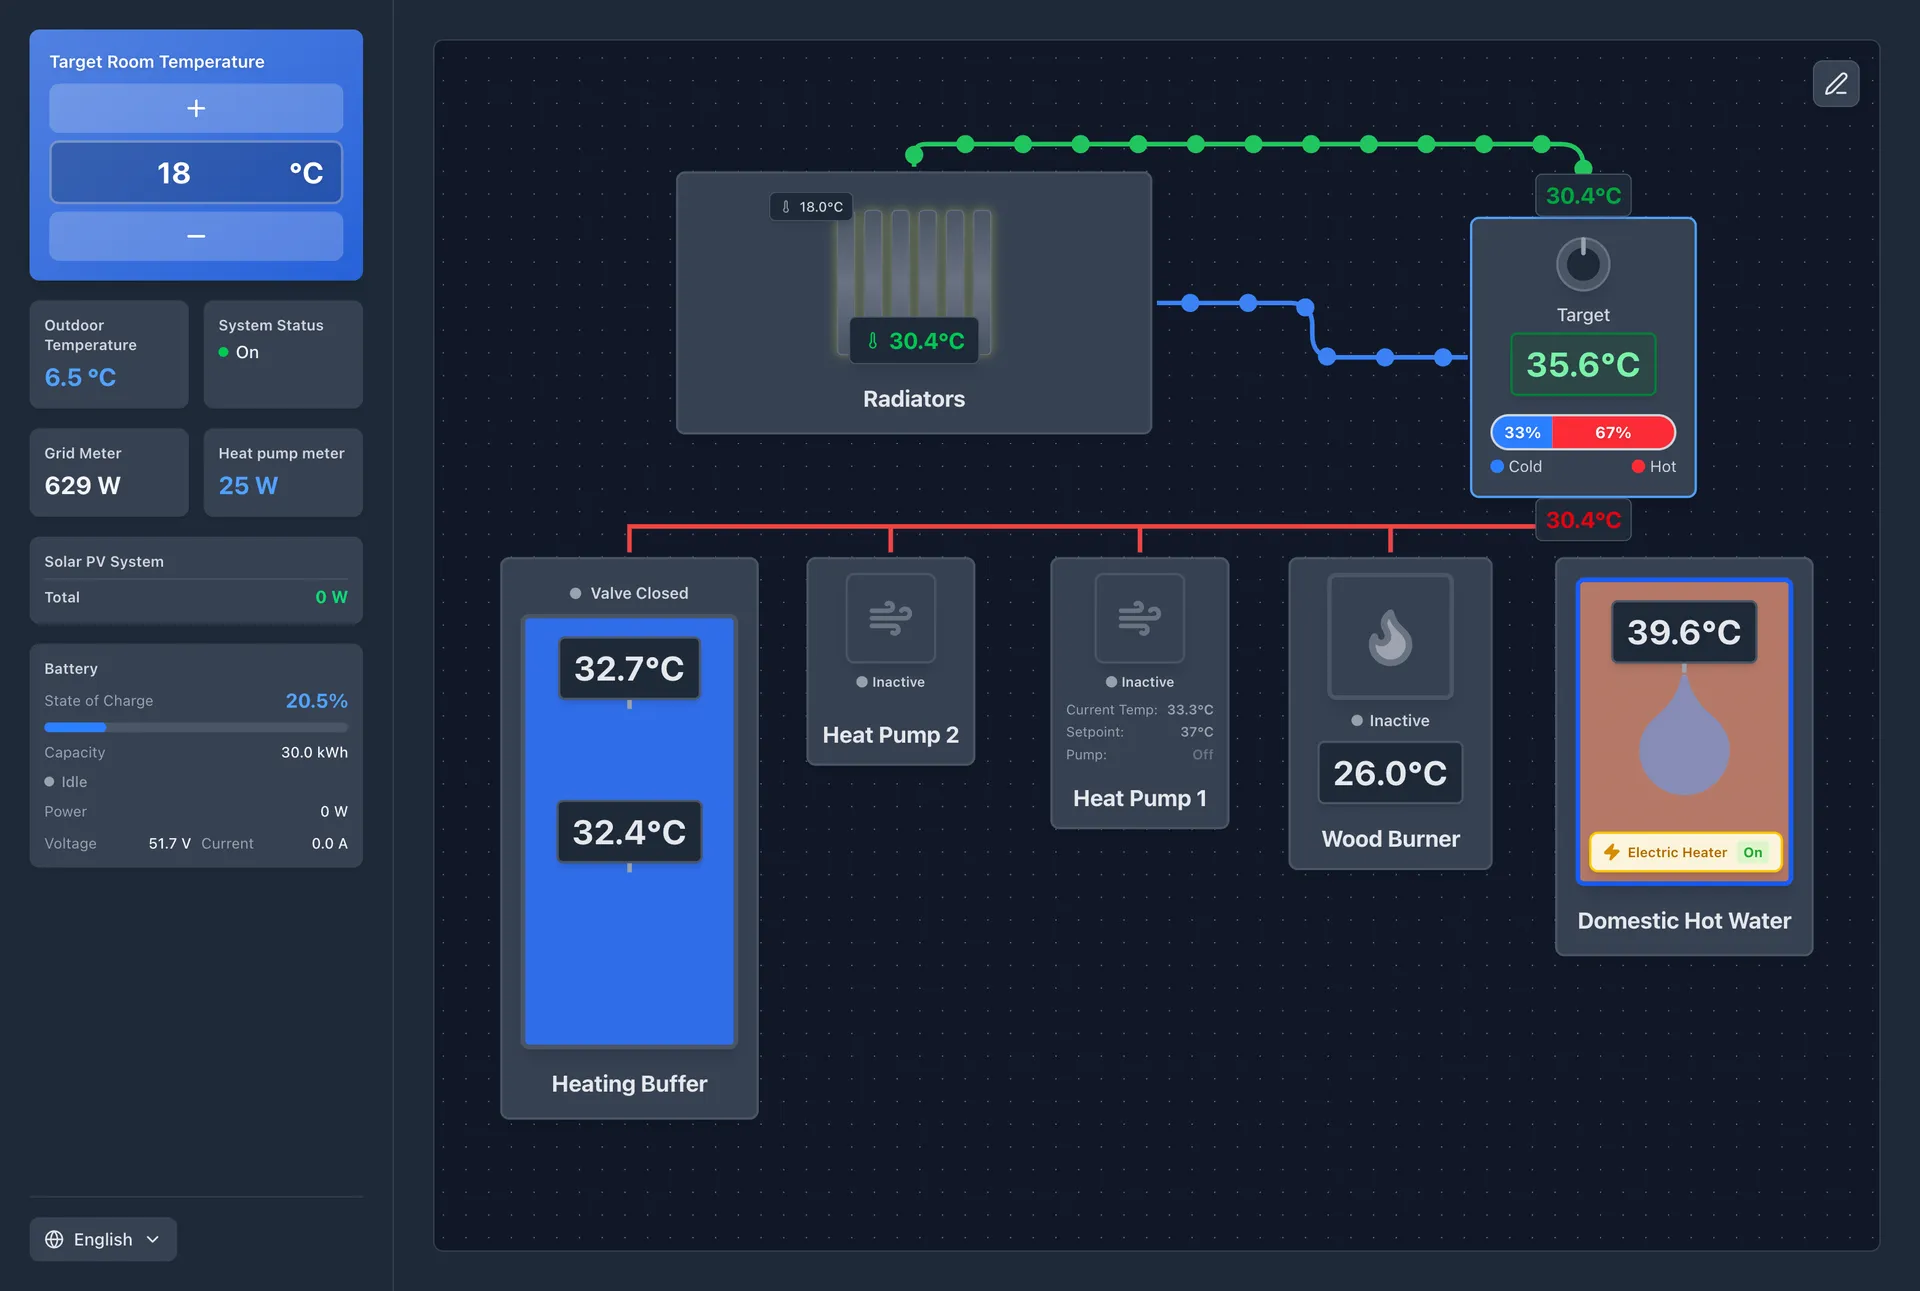
A visualisation of a complex heating system: real-time monitoring of every component in one place, privately hosted.
Delivery
Data capture, time-series storage and a dashboard that shows the system's state at a glance — Grafana on InfluxDB, wired to real sensors through Node-RED and MQTT.
Stack
- Grafana
- InfluxDB
- Node-RED
- MQTT